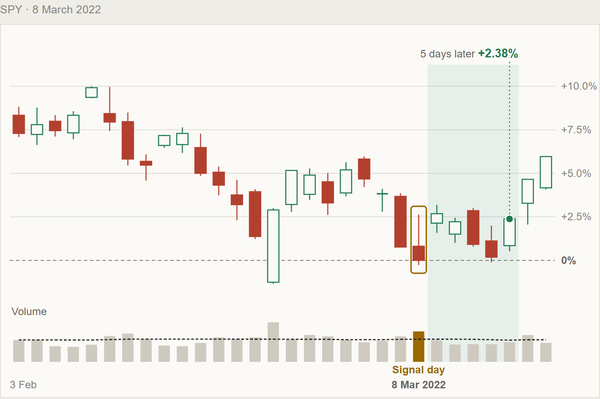
Christmas 2008, when SPY printed a setup three days running
In the worst stretch of 2008, SPY printed a gap-up harami on Christmas Eve, a quiet hammer on Boxing Day and another quiet hammer the Monday after. Each one finished the next five trading days more than 6% higher.

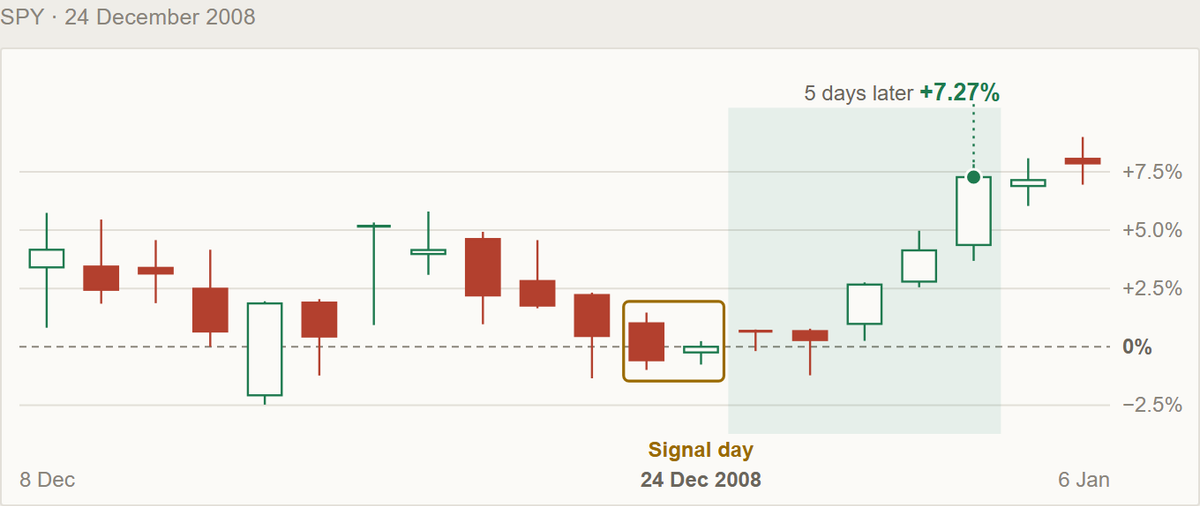
If you want to see what these setups look like when the market is at its most miserable, look at the last week of 2008.
SPY had fallen more than 40% in under three months that autumn, and all through December it sat about 30% down, going nowhere, with just about everybody ready to throw in the towel. Then, in the quiet days between Christmas and New Year's, it printed one of our setups on each of three trading days in a row.
Wednesday, December 24th: the harami
Christmas Eve was a half day. SPY opened above the previous day's close, finished green, and kept its open and close tucked inside the body of the red day before it: a gap-up harami, after a week that had finished lower.
Five sessions later SPY was 7.27% higher. It's the best harami of all the years we measured, on SPY since 2005 and QQQ since 2011.
Friday, December 26th: the quiet hammer
The very next session, Boxing Day, SPY printed a hammer. The price dipped during the day and the buyers took it all back by the close, on holiday volume about a fifth of a normal day. Quiet is exactly what you want from a hammer.
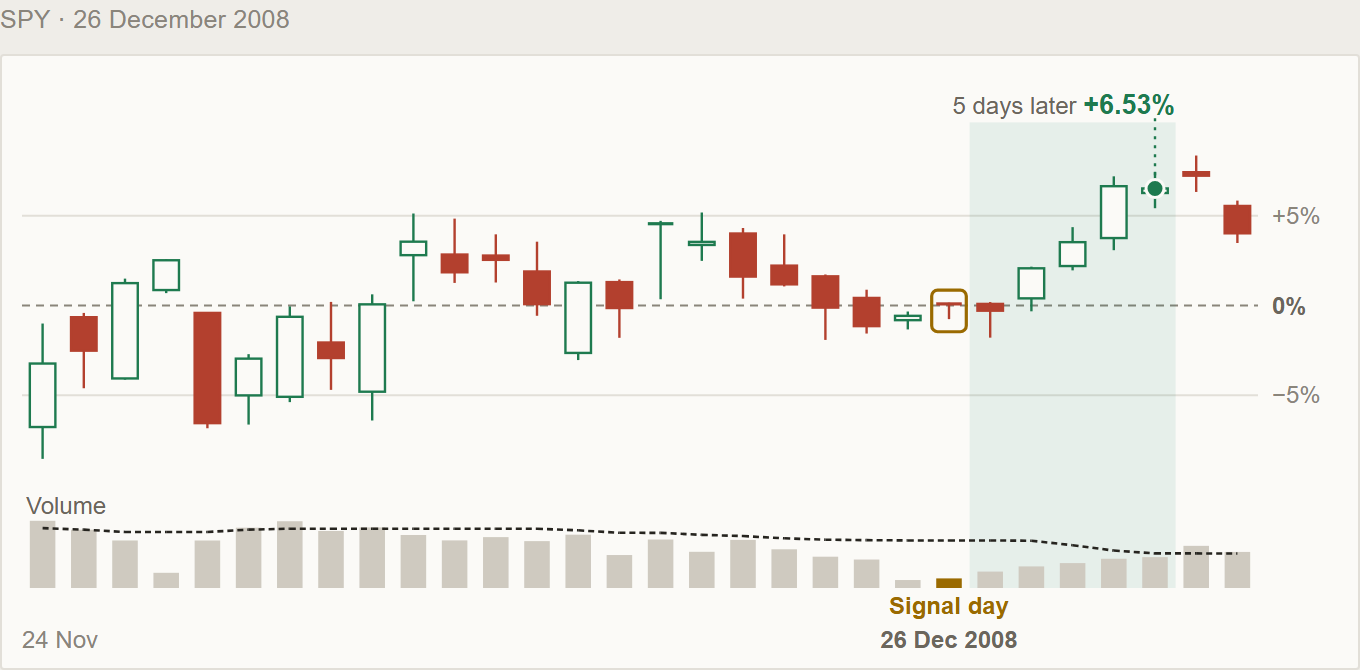
The first day after it went nowhere. By the fifth close SPY was 6.53% higher, one of the five best hammers of those years.
Monday, December 29th: another one
And on the Monday after, SPY printed a second quiet hammer, and over the next five trading days it climbed more than 7%.
So the two charts above, and that Monday, are really one rally seen three times. The selling had run out of sellers, and the candles said so three evenings in a row.
What made them count
None of these was just a nice-looking candle. Each one came after five sessions that finished lower, and each one passed its own condition: the harami opened with a gap, and both hammers came on quiet volume. Take those conditions away and the same shapes were nothing special.
The free guide has the exact rules for all three, and a checklist you can run on a free chart in a few minutes after the close.
Send me the free guide: Highest Performing Candlestick Patterns
You won't get a week like that every year. But the scanner checks for all three every evening after the close, on the 100 largest US stocks and on SPY, QQQ and IWM, so when one prints, it's waiting for you.
Try the Candlestick Pattern Scanner free
James H
Your Friendly Neighborhood Trading Nerd