
The candle that looks like the worst day to buy
The inverted hammer records a rally that fell apart before the close. After a down week, on a busy day, it finished higher five trading days later 77.1% of the time on SPY since 2005 and QQQ since 2011.

Of the three setups that held up in our testing, this is the one that looks least like a reason to buy. It's also the one that finished higher most often.
An inverted hammer after a down week, on heavier volume than usual, finished higher five trading days later 77.1% of the time on SPY since 2005 and QQQ since 2011. Most people would look at the candle and see a day the buyers lost, and on the day itself, they did.
What the candle records
An inverted hammer is the hammer turned upside down: a small body down at the bottom of the day's range, with a long wick sticking up above it. What that shape records is a rally that failed. The buyers pushed the price well above where it opened, and by the close the sellers had taken most of it back, often all of it.
SPY, two weeks into a war
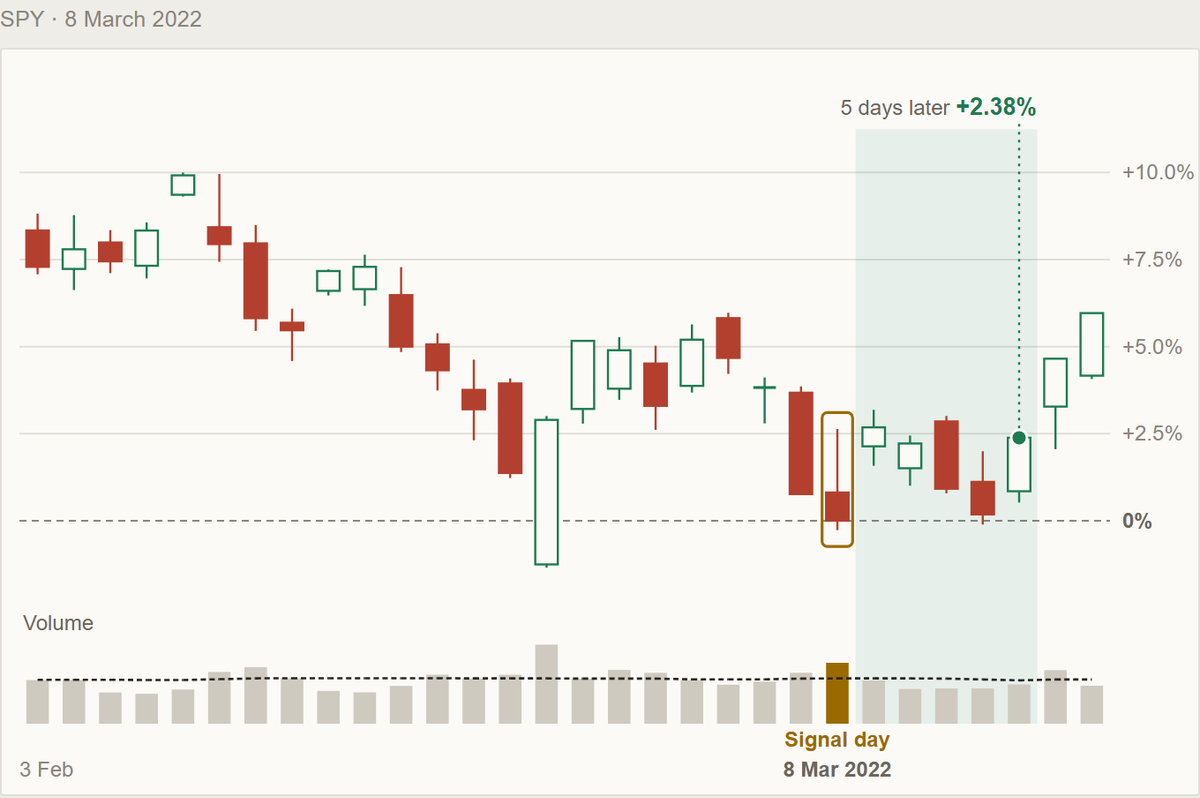
SPY printed a good one on Tuesday, March 8th, 2022, a couple of weeks after Russia invaded Ukraine. It came into that day almost 4% lower than it had closed five sessions earlier, after a week of war headlines and climbing oil prices.
That Tuesday SPY opened a hair above Monday's close, climbed almost 2% during the session, and then gave all of it back and more, closing near its low. If you looked at it that evening, it was one more bad day at the end of a bad week. The next morning SPY opened higher and finished the day up 2.68%, and five sessions after the signal it was 2.38% above Tuesday's close.
And a recent one, on Cisco
The scanner flagged the same setup on Cisco at the close on Friday, September 25th, 2026. Cisco had slid nearly 18% from its June high and lost another 4.5% on the Tuesday of that week. On Friday the buyers pushed it up during the day, the sellers shoved it right back down to close near the low, and more shares than usual changed hands.
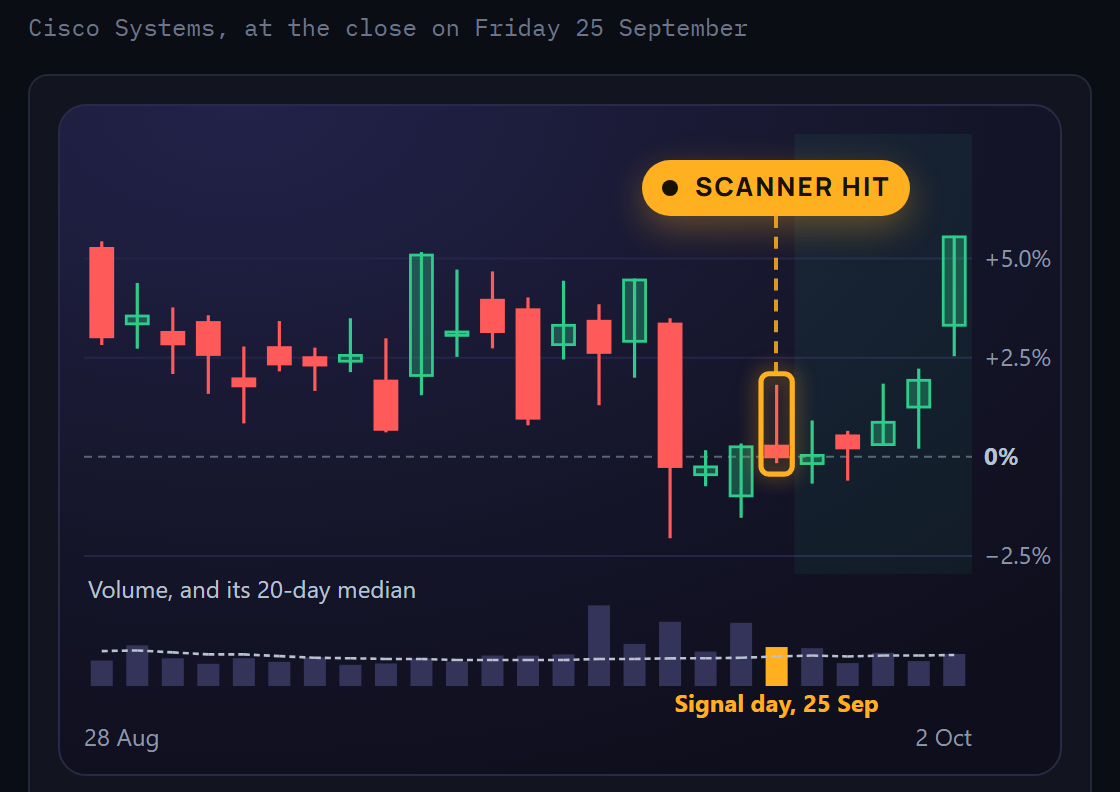
From Monday's open to Friday's close, Cisco rose a little over 5%.
Why the busy ones work
The volume is what separates the real thing from noise. On a quiet day, the same shape is a drift nobody much cared about, and since 1999 the quiet ones finished higher fewer than six times in ten. On a busy day after a week of selling, a lot of people tried to buy, and even though the sellers won the close, buyers who show up in those numbers seem to come back.
Given what the candle looks like, I didn't expect much from it. Of the three setups, it's the one that surprised me most.
The exact rule, and the shortcut
The free guide has the exact shape (how long the upper wick has to be, how small the lower one, where the close sits) and the volume check you can run on any free chart after the close.
Send me the free guide: Highest Performing Candlestick Patterns
Or let the scanner do it. It checks the wicks and the volume on the 100 largest US stocks and on SPY, QQQ and IWM every evening, and it doesn't care what the candle looks like, which with this one is exactly the point.
Try the Candlestick Pattern Scanner free
James H
Your Friendly Neighborhood Trading Nerd


