
The best hammers show up on a quiet day
A hammer after a down week, on a slow day, finished higher five trading days later 71.9% of the time on SPY since 2005 and QQQ since 2011. The same shape on a busy day averaged almost nothing.

Here's a fact I'd text a friend about. A hammer after a down week, printed on a quiet day, finished higher five trading days later 71.9% of the time on SPY since 2005 and QQQ since 2011. The exact same shape on a busy day averaged a gain of just 0.10% over the same five days.
Same candle, same slide before it, and the only thing that changed was how many shares traded. That one line is the difference between the best setup we've found and one that barely moves.
What a hammer is
A hammer is a small body sitting up near the top of the day's range, with a long wick hanging underneath it. What that shape records is a fight the buyers won: during the session the price was pushed well down, and by the close the buyers had taken it all back and the day finished near its high.
On its own that's a common sight, and on its own it isn't much to go on. It needs the five sessions before it to have finished lower, because a reversal needs something to reverse. And it needs the quiet volume.
The Boxing Day hammer
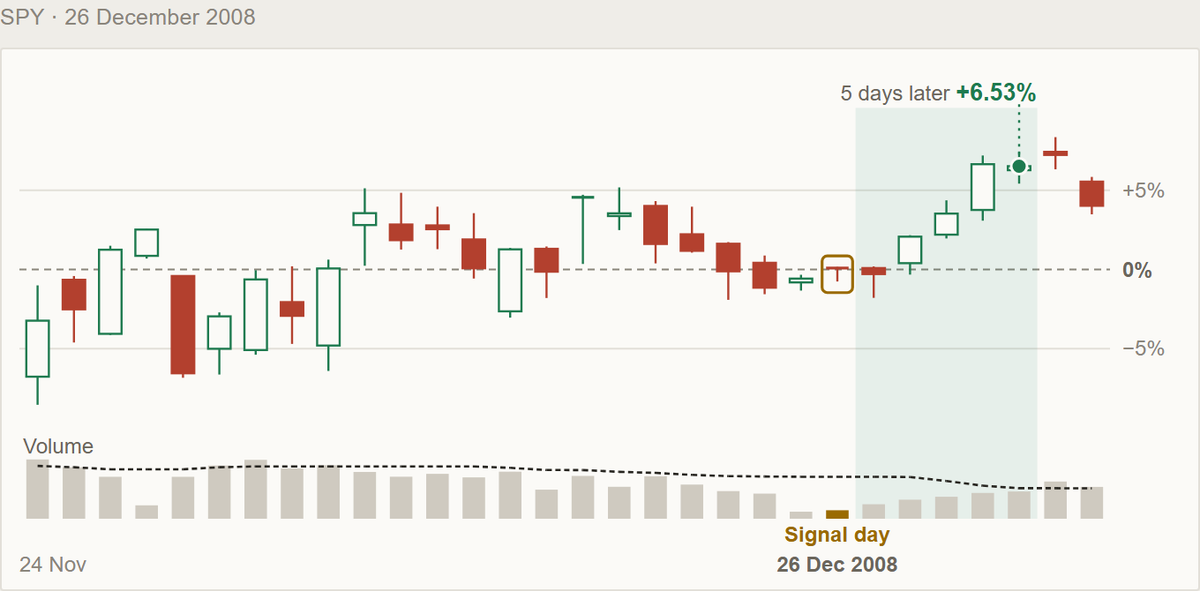
My favorite example is the Friday after Christmas in 2008. SPY had spent the autumn falling more than 40% in under three months, and by late December it was stuck about 30% down, with just about everybody ready to give up on it.
On Boxing Day it printed a hammer on holiday volume, about a fifth of a normal day. The first day after it went nowhere, which is exactly the kind of day that shakes people out, and by the fifth close SPY was 6.53% higher. It's one of the five best hammers of those years.
The best one QQQ ever printed
The other one I'd show you is QQQ in May 2022, in the middle of that year's bear market.
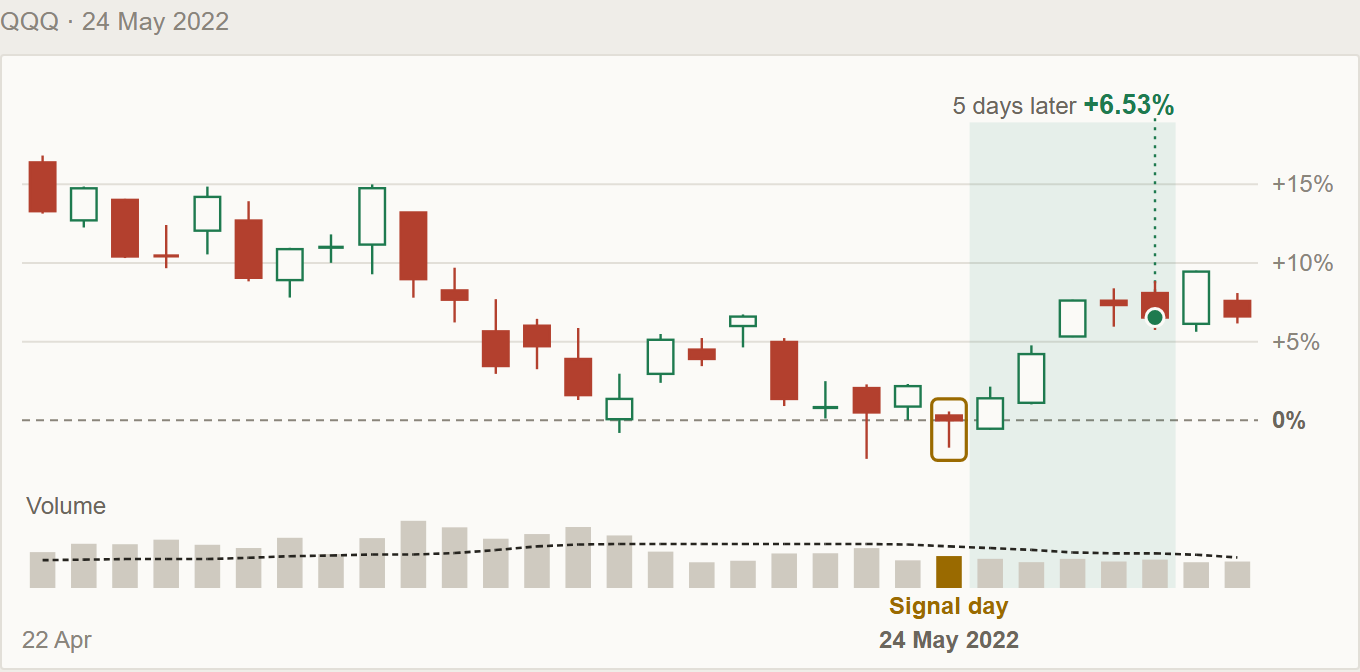
On Tuesday, May 24th, QQQ opened almost 2% lower, got bought back through the session, and finished near the top of the day. Five sessions later it was 6.53% higher, the best hammer QQQ produced over those years.
Why quiet beats busy
My best guess at why is this. A hammer on heavy volume is often a crowd still thrashing in both directions, with plenty of sellers left over for tomorrow. A quiet one looks like a slide that simply ran out of people who wanted to sell, so lower prices got refused on a day when hardly anybody was trading.
I'll admit this is my favorite finding of the lot. I ran it back to 1999 to try to break it, and the gap between the quiet hammers and the loud ones in how often they finished higher only got wider.
The exact rule, and the shortcut
The free guide has the exact rule: how long the lower wick has to be against the body, where the close has to sit, and how to check the volume against its twenty-day median on a free chart in a couple of minutes.
Send me the free guide: Highest Performing Candlestick Patterns
Or skip the checking. Our scanner runs the five-day slide, the wick and the volume test on more than a hundred charts every evening after the close, and shows you the quiet hammers on the stocks where they've worked before.
Try the Candlestick Pattern Scanner free
James H
Your Friendly Neighborhood Trading Nerd


